
In a series of blog posts, we will explore various usage scenarios for MindFusion software components, based mostly on technical support questions we are frequently asked. Today’s post shows how to assign colors to map regions, depending on the value of a field in the map’s associated DBF database. This particular example assigns darker shades of red to countries with larger populations.
Let’s load an ESRI map file and its database into the map view’s BaseMap property, which provides a shortcut for setting a map in the first layer of the view:
// load the map file and dbf database
var map = mapView.BaseMap = Map.FromFile(
	"ne_50m_admin_0_countries.shp", true, "NAME");
var db = map.Database;
var layer = mapView.Layers[0];
Next, create an array of population threshold values, which will correspond to different values in the layer’s color palette:
// specify threshold values that trigger more saturated colors
var m = 1000000;
var populationThreshold = new[]
{
	0, 1*m, 5*m, 10*m, 50*m, 100*m, 1000*m
};

int numColors = populationThreshold.Length;
Define the map colors as shades of red:
// set the layer palette with a color for each threshold value
layer.FillColors = new Color[numColors];
layer.FillColors[0] = Color.WhiteSmoke;
for (int i = 1; i < numColors; i++)
{
	layer.FillColors[i] = Color.FromArgb(
		255,
		255 - 255 / (numColors - i),
		255 - 255 / (numColors - i));
}
Iterate over the database records, find their corresponding shape from the ESRI .shp file, and read the population field:
// for each database record, read population field and set color
for (int i = 0; i < db.Rows.Count; i++)
{
	var countryShape = map.Shapes[i];
	var population = float.Parse(db.Rows[i]["POP_EST"]);
	…
}
Finally, determine the shape’s color from the maximal threshold value smaller than the country’s population:
	for (int c = numColors - 1; c >= 0; c--)
	{
		if (population > populationThreshold[c])
		{
			countryShape.Color = c;
			break;
		}
	}
The resulting custom-colored map is shown in this screenshot:
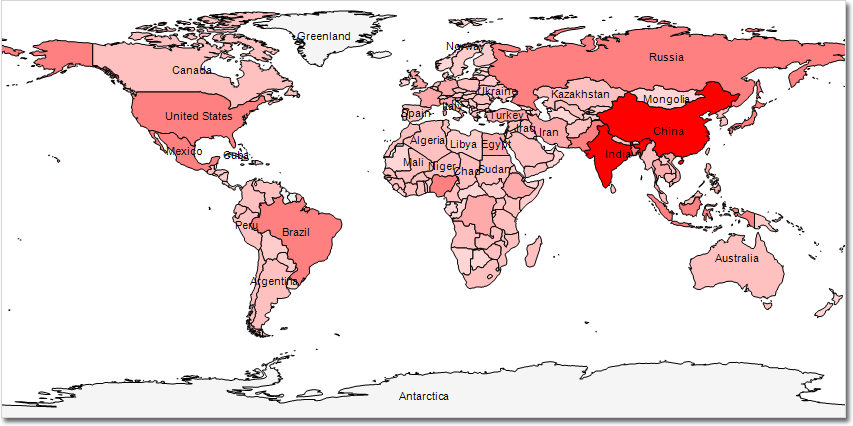
Labels for countries are displayed dynamically e.g. they are hidden if space is not enough. In the sample pictured above you will see all labels if you zoom in the map.
A VS2008 solution that includes the full source code and map files can be downloaded here:
https://mindfusion.eu/_samples/ColorCoding.zip
Enjoy!