
In this post we show how to build a PERT network chart using MindFusion.Diagramming for WPF.
First, create a new WPF project and add a mindfusion.diagramming.wpf.dll reference. Add the appropriate Xaml namespace to the window Xaml file:
xmlns:diag="http://mindfusion.eu/diagramming/wpf"
Add a ScrollViewer and Diagram to the window markup:
<scrollviewer>
	<diag:diagram x:name="diagram">
</diag:diagram></scrollviewer>
There are two conventions for drawing PERT networks: activity on arrow and activity on node. Activity on arrow shows activity information on arrows, and the nodes they connect represent project milestones. Activity on node shows activity information on nodes and the arrows between them display relationships. We will use the first convention.
Let’s define a model class to hold activity data:
public class Activity
{
	// activity name
	public string Name { get; set; }

	// start milestone name
	public string From { get; set; }

	// end milestone  name
	public string To { get; set; }

	// time in months
	public int Time { get; set; }
}
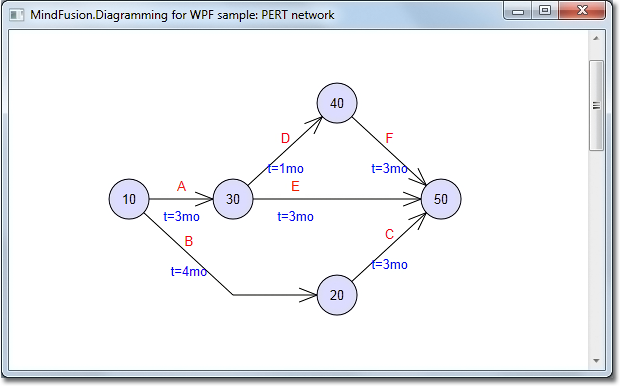
Define a simple PERT project consisting of five milestones and six activities:
var network = new[]
{
	new Activity { Name = "A", From = "10", To = "30", Time = 3 },
	new Activity { Name = "B", From = "10", To = "20", Time = 4 },
	new Activity { Name = "C", From = "20", To = "50", Time = 3 },
	new Activity { Name = "D", From = "30", To = "40", Time = 1 },
	new Activity { Name = "E", From = "30", To = "50", Time = 3 },
	new Activity { Name = "F", From = "40", To = "50", Time = 3 }
};
Create a diagram node for each milestone in the project:
// create diagram nodes for each milestone
foreach (var activity in network)
{
	if (diagram.FindNodeById(activity.From) == null)
	{
		var node = diagram.Factory.CreateShapeNode(bounds, Shapes.Ellipse);
		node.Id = node.Text = activity.From;
	}

	if (diagram.FindNodeById(activity.To) == null)
	{
		var node = diagram.Factory.CreateShapeNode(bounds, Shapes.Ellipse);
		node.Id = node.Text = activity.To;
	}
}
Create a diagram link for each activity and display the activity name and estimated time as link labels:
// create a diagram link for each activity
foreach (var activity in network)
{
	var link = diagram.Factory.CreateDiagramLink(
		diagram.FindNodeById(activity.From),
		diagram.FindNodeById(activity.To));

	var label1 = link.AddLabel(activity.Name);
	label1.RelativeTo = RelativeToLink.Segment;
	label1.Index = 0;
	label1.VerticalOffset = -20;
	label1.TextBrush = new SolidColorBrush(Colors.Red);

	var label2 = link.AddLabel(string.Format("t={0}mo", activity.Time));
	label2.RelativeTo = RelativeToLink.Segment;
	label2.Index = 0;
	label2.VerticalOffset = 10;
	label2.TextBrush = new SolidColorBrush(Colors.Blue);
}
Use automatic graph layout algorithm to arrange the PERT network chart:
// arrange the diagram from left to right
var layout = new LayeredLayout();
layout.Margins = new Size(100, 100);
layout.EnforceLinkFlow = true;
layout.Orientation = Orientation.Horizontal;
layout.Arrange(diagram);
The final result is displayed below.
For more information on the PERT methodology, see this Wikipedia article:
http://en.wikipedia.org/wiki/PERT
The complete sample project is available for download here:
https://mindfusion.eu/_samples/PertNetwork.zip
All MindFusion.Diagramming libraries expose the same programming interface, so most of the sample code shown above will work with only a few modifications in Windows Forms, ASP.NET, Silverlight and Java versions of the control.
Enjoy!