
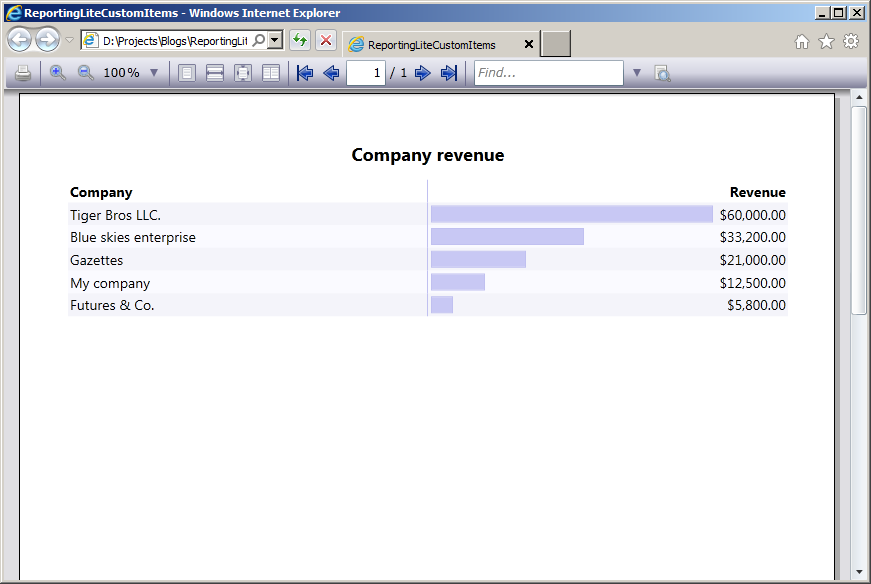
In this post we will examine how to use custom items in MindFusion reports in Silverlight. The report in question will display the revenue of several companies, sorted in descending order. The custom items will visualize the relative revenue value of each company as a graphics similar to a chart.
To start off, we will define our business objects – a CompanyInfo class with two properties – Name and Revenue, of type string and double respectively.
public class CompanyInfo
{
  public string Name { get; set; }
  public double Revenue { get; set; }
}
Then we will declare sample data – an array of several companies, sorted by revenue:
var companyInfo = new CompanyInfo[]
{
  new CompanyInfo { Name = "My company", Revenue = 12500 },
  new CompanyInfo { Name = "Blue skies enterprise", Revenue = 33200 },
  new CompanyInfo { Name = "Futures & Co.", Revenue = 5800 },
  new CompanyInfo { Name = "Gazettes", Revenue = 21000 },
  new CompanyInfo { Name = "Tiger Bros LLC.", Revenue = 60000 },
}.OrderByDescending(info => info.Revenue);
The actual report is placed inside Resource Dictionary (named MyReport.xaml). The report contains a title and a single data range with three columns – for company name, revenue graphics and revenue value respectively. The actual report is omitted for brevity, but the code of the custom item representing the revenue graphics is shown below:
<report:CustomReportItem Location="50%,0" Size="40%,6" Value="[100*Revenue/Max("Revenue")]"> <report:CustomReportItem.Template> <DataTemplate> <Grid> <Grid.ColumnDefinitions> <ColumnDefinition Width="{Binding Converter={StaticResource gridLengthConverter}}" /> <ColumnDefinition Width="{Binding Converter={StaticResource gridLengthConverter}, ConverterParameter='-'}" /> <ColumnDefinition /> <Border BorderBrush="#C0C0F0" BorderThickness="1" Background="#C8C8F4" Margin="3" /> </Grid> </DataTemplate> </report:CustomReportItem.Template> </report:CustomReportItem>
The value of the custom item is calculated as the percentage of the company revenue relative to the maximum revenue amongst all companies. The content of the custom item represents a grid with two columns. The first column contains the border that is used as the representation of the revenue graphics. The width of the columns is calculated according to the item value by using a custom value converter – GridLengthConverter. The GridLengthConverter basically converts the value to a GridLength object with GridUnitType set to Star.
The report is loaded from the resource dictionary using the helper Report.FromDictionary method, then setup with the data and run:
var report = Report.FromDictionary(new Uri("ReportingLiteCustomItems;component/MyReport.xaml", UriKind.Relative), "myReport");
report.DataContext = companyInfo;
report.QueryDetails += (s, e) => e.Details = companyInfo;
report.Run()
Note, that the sample handles the QueryDetails event. This is done in order to supply data to the Max aggregate function used inside the CustomReportItem.Value expression.
Finally, the report is selected inside a ReportViewer on the main form:
viewer.Document = report;
The following image shows the running sample:
The source code is available for download from here:
Download the Complete Source Code for the Sample
You can get the trial version of MindFusion.Reporting for Silverlight from this link: