|
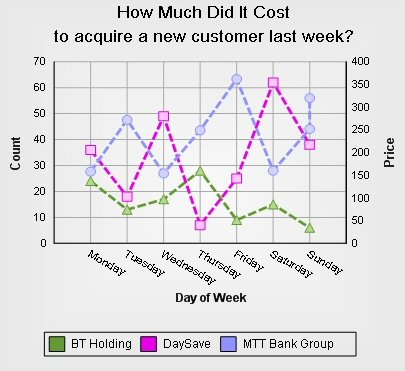
A 2D line chart with three data series and crossed grid. Shapes show the data points at each graphics.
The chart has two Y - axis that show two different auto scales. Explanation labels at both Y axes are drawn rotated. The labels at the X - axis are custom text.
|