


The list below describes recent changes and additions to MindFusion.Charting for WPF:
New in Version 2.2.1
.NET 5 support
The Charting.WPF distribution now includes assemblies for .NET 5. Locally installed assemblies don't show automatically in toolbox at this time, you can add them to projects either manually or through Nuget package manager.Miscellaneous
- Specify custom grid line positions by setting GridType to Custom and assigning coordinates to XGridLines and YGridLines collections.
- Fixed segment clipping in linecharts for values outside of current vertical range.
New in Version 2.2
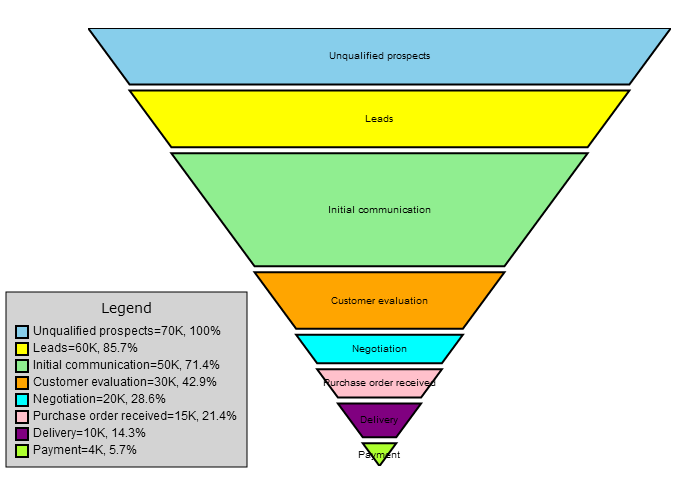
Funnel Chart
Funnel charts are often used to represent the stages of a process and show relative values or measurements associated with each stage. In MindFusion.Charting API, funnel charts can be created using the FunnelChart control associated with a FunnelSeries providing data. FunnelChart inherits appearance properties from the base Chart class, and offers additional customization through StemWidth and SegmentPadding properties.
Miscellaneous
- Set ShowCrosshairs to display crosshairs in RealTimeChart.
- InnerLabelAlignment property of BarSeries lets you customize label alignment in bars.
- ClearMeshSelection method lets you clear selected meshes in 3D charts.
New in Version 2.1
Candlestick Charts
The CandlestickSeries class represents movements of stock or currency prices in financial charts. Individual values in the chart are specified via StockPrice objects assigned to the series' Values property. Candlestick bodies are filled using brushes from the Fills collection if ones are specified, or otherwise with the FallingPriceBrush and RisingPriceBrush depending on the difference between Open and Close prices. CandlestickSeries can be added to either LineChart or BarChart controls.
Miscellaneous
- Bars in BarChart3D can be rendered as cylinders by setting the new BarModel3D property to Cylinder.
- LineChart performance has been improved when rendering large data-sets.
API Changes
- Piece substrings renamed to Slice in PieChart properties and related types.
- CrossHair substrings' capitalization changed to Crosshair in AxesChart properties.
New in Version 2.0
Improved Zooming
Selected area with width smaller than MinZoomSpan does not evoke any action in the control. In addition, the new ZoomChanged event fires whenever
zoom occurs and provides useful data for the zoom action with its ZoomChangedArgs.
Crosshair Improvements
The crosshair control has been improved with several new properties, a method and an event. The properties are:
- CrosshairBackground, which lets you change the background of the control.
- CrosshairTemplate, which you can use to set your own ControlTemplate for the crosshair.
- CrosshairType that let you choose among several types of crosshair to display.
The new CrosshairPosition method returns the current location of the crosshair. For more precise handling of crosshair movements a new event is
available - CrosshairPositionChanged.
Greatly Improved 3D Charts
3D charts have received plenty of improvements, ne properties and performance optimizations:
PointMergeThreshold - The property sets the radius of an area around a given point where no other points are drawn. The result is better performance
especially in charts with numerous points, which happen to be close to one another. Of points with similar coordinates only a single one is rendered,
the rest are omitted.
InterpolationType.None - A new InterpolationType has been added to the InterpolationType, which does not interpolation but adds data directly and
connects the points with triangulation.
The SurfaceType enum has been replaced with three bool properties, which makes the API easier to understand and use.
- ShowSurface - shows/hides the surface of a 3D chart
- ShowScatters - shows/hides the scatters
- ShowWireFrame - shows/hides the wireframe
ScatterFaceSize - the property regulates the size of the polygons that build a 3D scatter. Bigger values lead to bigger polygons, which results in
faster performance and more rough scatter mesh.
Effect3D.ShaderEffect - the property can be applied to all 3D chart elements, including scatters and performs much faster.
Exporting Images
Two new methods have been added for exporting the chart as an image - CreateImage and ExportImage.
Custom Formatting of Labels in Real-time Charts
A new property has been added to the RealTimeChart library - Axis.LabelFormatProvider. Use it to specify custom formatting of numeric labels. If required, you can specify format arguments for your format classes with Axis.LabelFormat.