This tutorial will teach you how to create and customize a 3D bar chart with Charting for WPF.
1. Getting started
Drag the icon of the 3D bar chart onto your work area in design time if you use Microsoft Visual Studio. In code, you can create the new chart like this:
C#
 Copy Code Copy Code
|
|---|
BarChart3D bChart = new BarChart3D(); |
| VB.NET
Copy Code
|
|---|
Dim bChart As BarChart3D = New BarChart3D |
Now you have the default BarChart3D onto your form.
2. Customize the appearance
When you want to show more series in a 3D bar chart you must change the BarType3D property to a value that uses multiple series. The 3D model is going to be bigger when the series are more and we will change the ModelHeight property to let all bars be drawn in reasonable space:
| C#
Copy Code
|
|---|
barChart3D1.BarType3D = BarType3D.VerticalInColumn; |
| VB.NET
Copy Code
|
|---|
barChart3D1.BarType3D = BarType3D.VerticalInColumn |
3. Data
3.1 Set the DataSource
In our chart we will use an instance of the System.Collections.ObjectModel.ObservableCollection where we store data for the chart. The name of this collection is sales.
| C#
Copy Code
|
|---|
barChart3D1.DataSource = sales; |
| VB.NET
Copy Code
|
|---|
barChart3D1.DataSource = sales |
4. Create ChartSeries
The BarChart3D has a Series property that holds BarSeries objects, which represent the series of the chart. When we create a new series, we add it to the BarChart3D.Series property:
| C#
Copy Code
|
|---|
//remove the predefined series |
| VB.NET
Copy Code
|
|---|
'remove the predefined series |
5. Customize the axis
5.1 X-axis
We want to show custom labels at the X-axis and we will read them from our ObservableCollection list. We will also change the label for the X-axis and increase its offset from the axis labels:
| C#
Copy Code
|
|---|
barChart3D1.XAxisSettings.LabelType = LabelType.CustomText; |
| VB.NET
Copy Code
|
|---|
barChart3D1.XAxisSettings.LabelType = LabelType.CustomText |
5.2 Y-axis
For the Y-axis we want to change the interval of the axis, its title and the offset of the title to the axis labels.
| C#
Copy Code
|
|---|
barChart3D1.YAxisSettings.Interval = 50; |
| VB.NET
Copy Code
|
|---|
barChart3D1.YAxisSettings.Interval = 50 |
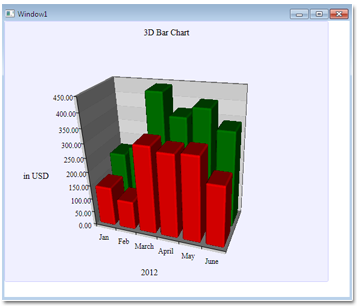
Here is the final chart: