This tutorial will walk you through the steps to create a 3D pie chart with two data series. Pie data is read through data binding.
1. Create the pie chart
You can create the chart in the XAML editor by dragging the icon for the 3D pie chart and dropping it at your work area. Alternatively, you can create the chart through code:
C#
 Copy Code Copy Code
|
|---|
PieChart3D pChart = new PieChart3D(); |
| VB.NET
Copy Code
|
|---|
Dim pChart As PieChart3D = New PieChart3D |
2. Create the PieSeries
Each chart has initially a default series - we clear it and create our two pie series from scratch:
| C#
Copy Code
|
|---|
pieChart3D1.Series.Clear(); |
| VB.NET
Copy Code
|
|---|
pieChart3D1.Series.Clear |
The data for the pie chart is taken from an ObservableCollection called sales. It has two fields - Profit and Turnover that will provide data for the pie series:
| C#
Copy Code
|
|---|
pieChart3D1.DataSource = "sales"; |
| VB.NET
Copy Code
|
|---|
pieChart3D1.DataSource = "sales" |
3. Set the labels
We want to show the percent value for each slice inside it. For this we use the InnerLabelType property. We adjust the location of the labels with InnerLabelLocation. The font is bold.
| C#
Copy Code
|
|---|
series1.InnerLabelLocation = 0.7; |
| VB.NET
Copy Code
|
|---|
series1.InnerLabelLocation = 0.7 |
4. Customizing the appearance
We increase the thickness of the doughnut series with DoughnutThickness and create a set of brushes for the slices:
| C#
Copy Code
|
|---|
pieChart3D1.DoughnutThickness = 2; |
| VB.NET
Copy Code
|
|---|
pieChart3D1.DoughnutThickness = 2 |
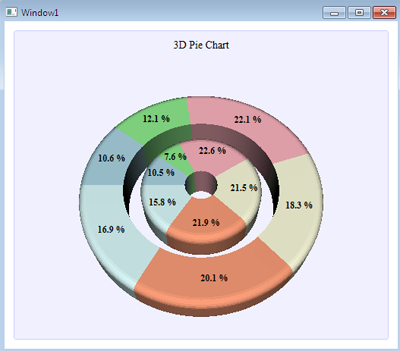
Here is the final chart: