A real time chart is a type of line chart that can handle large number of points in a fast and efficient manner. Charting for WPF provides a special library, which you can use to render exactly those types of charts. Here are the major steps you need to follow if you plan to implement a real time chart into your application.
1. Initialize the control
Drag the RealTimeChart icon from the Visual Studio Toolbox onto the window of your WPF application. A new instance of the control is created:
XAML
 Copy Code Copy Code
|
|---|
<my:RealTimeChart Margin="12" Name="realTimeChart1" /> |
2. Create the X-axis
We use the XAxis property of the control to specify how our X-axis will look. First, we set the intervals and the length of the axis. We want the axis to start at 0 (its Origin), which also where the first label is drawn (LabelOrigin):
| C#
Copy Code
|
|---|
chart1.XAxis.Length = 300; |
We need a title, drawn with a bigger font:
| C#
Copy Code
|
|---|
chart1.XAxis.Title = "Time"; |
Finally, we tell the control not to pin the labels - e.g. they will slide along the axes with the change of data:
| C#
Copy Code
|
|---|
chart1.XAxis.PinLabels = false; |
3. Adding Y-axes
We create a new Axis object and set its length, origin and interval. We set a title, no special settings for the title font. We want ticks and use TickLength to specify them. Finally, we add the newly created axis to the collection of Y-axes:
| C#
Copy Code
|
|---|
Axis axis = new Axis(); |
We want to add an Y-axis to the right of the plot area. When we create the axes, we add it to the Y2AxisCollection. Note that we align the labels to the right, because the axis is aligned to the right:
| C#
Copy Code
|
|---|
Axis axis2 = new Axis(); |
4. Adding Chart Series
Series should be bound to an Y-axis. We create two series, each one bound to one of the one of the Y-axis that we have. It is important to give our series a title - it will show in the legend. We create the series with diamond scatters at data points.
| C#
Copy Code
|
|---|
//series bound to the left Y-axis |
The second series is bound to Y2:
| C#
Copy Code
|
|---|
//series bound to the right Y-axis |
It's important that you add the series to the SeriesCollection. Otherwise they will not show in the graphic:
| C#
Copy Code
|
|---|
realTimeChart.SeriesCollection.Add(series1); |
5. Setting data
Data is added as single Point objects or a collection of Point-s to the Data property of the Series.
| C#
Copy Code
|
|---|
series1.Data.Add(new Point(x1, y1)); |
Please, note that you must call Commit() to update the chart:
| C#
Copy Code
|
|---|
//Update the chart |
6. Background image
We add a *.png file to the project in Visual Studio with the "Add existing item" menn. Then, we create an image brush from that file and set it as a background to the grid, which is our layout control. Here is the code in XAML:
| C#
Copy Code
|
|---|
<Grid.Background> |
The background of the RealTimeChart must be transparent for the image to show through:
| C#
Copy Code
|
|---|
<my:RealTimeChart Margin="12" Name="realTimeChart" Background="Transparent"/> |
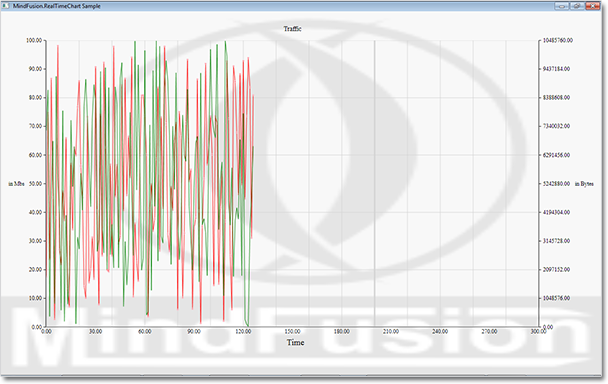
7. We are ready!
Here is the chart we've built: