


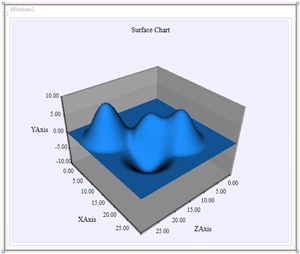
A surface chart is a 3D chart that plots the correlation between its data points. It is useful for spotting trends or patterns. Charting for WPF offers you a quick and intuitive way to implement and customize a surface chart into your application - look at the following steps:
1. Create the surface chart
In design time, drag the icon of the surface chart from the tool box and place it at the desired control container (grid, window, panel etc.) of your application. You can also create the chart programmatically:
C#
 Copy Code Copy Code
|
|---|
SurfaceChart chart = new SurfaceChart(); |
| VB.NET
Copy Code
|
|---|
Dim chart As New SurfaceChart() |
2. Data
The data can be set either through numbers or data binding.
2.1 Set numerical arrays
Each of the XData, YData and ZData properties represent a one-dimensional list, where you add your data or assign directly an array to the property:
| C#
Copy Code
|
|---|
SurfaceSeries surfaceSeries = surfaceChart1.Series[0] as SurfaceSeries; |
| VB.NET
Copy Code
|
|---|
Dim surfaceSeries As SurfaceSeries = TryCast(surfaceChart1.Series(0), SurfaceSeries) |
3. The surface
3.1 Surface color
The surface is drawn with its respective Brush (as specified in the SurfaceSeries.Fills) when the TextureType property is set to Brush.
| C#
Copy Code
|
|---|
surfaceChart1.TextureType = TextureType.Brush; |
| VB.NET
Copy Code
|
|---|
surfaceChart1.TextureType = TextureType.Brush |
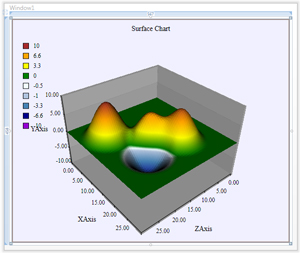
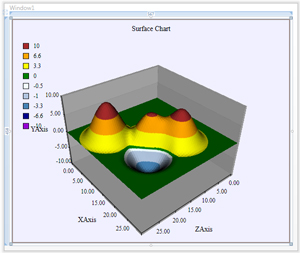
3.2 Color map
You can draw the surface in different colors, which will demonstrate the distinction between the values. To do this, set the appropriate colors in the ColorMapList property and set TextureType to GradientColorMap or ExactColorMap.
|
|
Gradient color map. | Exact color map. |
3.3 Wireframe
The chart can have a grid of lines at the surface that is called a wireframe. Set ShowWireFrame to true to display the wireframe. You can turn off color or color map for a chart that has a wireframe and vice versa - add a wireframe to each chart that has a surface color or colormap. The wireframe is drawn using the respective Brush (as specified in SurfaceSeries.Strokes) and its size is specified through the WireFrameThickness property.

3.4 Customizing how the surface is drawn
The surface can be drawn in oval shapes (slopes) when the InterpolationType property is set to Bezier. Alternatively, when the InterpolationType is Linear the slopes will appear as pyramids. The InterpolationSensitivity gives the radius, at which the elevation slope will be drawn - smaller values make up for steeper slopes and vice versa.
4. Camera
You can choose between a Perspective and Orthographic camera and between Directional and Ambient light. They are set with CameraType and LightType. If you enable AllowCameraInteraction the user will be able to change the position of the camera by clicking on the chart and dragging with the mouse. You can set the initial rotation angle and axis with the RotationAngle and RotationAxis properties.
5. Scale
If you want the chart to appear smaller or larger use the Scale property and assign to it the desired zoom factor.