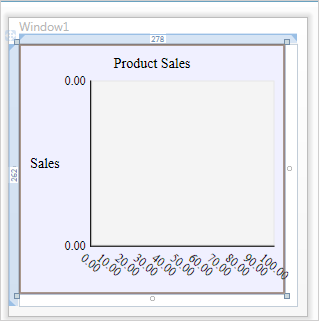
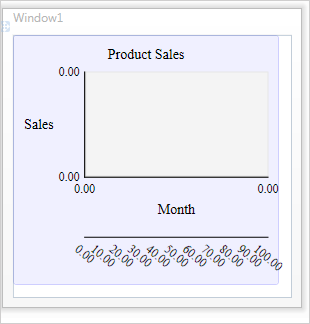
This topic is only relevant for charts that use the Cartesian coordinate system.
The XAxes, YAxes, X2Axes and Y2Axes are used for setting the properties of the axes. Each chart can have as many axes of each type as needed. Create an object of type Axis, set the desired properties and add it to the respective AxesCollection cited above.
In 3D surface charts the properties for the Z-axis are set with ZAxisSettings. The labels at each axis depend on LabelType.
If the LabelType is LabelType.CustomText there are two options for placing custom labels:
- at scale divisions - the Axis.CustomLabelPosition property should be set to CustomLabelPosition.AutoScalePoints
- at the position of data points - the Axis.CustomLabelPosition property should be set to CustomLabelPosition.ChartDataPoints
Custom labels are placed either at data points or at the intervals of the axis - see the CustomLabelPosition property. The Title property sets the title of the axis.
Custom labels are specified with the Labels property. Of course, you can use data binding - specify the name of the data bound property with LabelPath.
The sample code demonstrates how to set custom labels using a list as well using a data bound property:
C#
 Copy Code Copy Code
|
|---|
barChart1.DataSource = salesStatistics; Axis yAxis = new Axis(); |
VB.NET
 Copy Code Copy Code
|
|---|
barChart1.DataSource = salesStatistics |
The axis can be customized by the MinValue, MaxValue and Interval. They set the exact start and end numbers as well the size thus the count of the intervals between them.
You can set the count of the intervals at the axis explicitly with the IntervalCount property. In this case, the Interval property will not be considered and the length of the interval will be calculated based on Axis.MinValue, Axis.MaxValue and Axis.IntervalCount.
The sample code below shows how to set an axis that shows the divisions from 0 to 1000, divided at intervals of 100:
C#
 Copy Code Copy Code
|
|---|
Axis xAxis = new Axis(); |
VB.NET
 Copy Code Copy Code
|
|---|
barChart1.XAxisSettings.MinValue = 0 |
If you want to use DateTime data in your chart, please refer to the DateTime Values topic - there are detailed instructions how to set the chart axis when data is DateTime values.
Second Y-axis
If you want to show the second Y-axis, all you should create an Axis object and add it to the Y2Axes property. Set the scale with Axis.MinValue, Axis.MaxValue and Axis.Interval. Alternatively you can set the value of the Y2Data or Y2DataPath properties in an axes chart - in this case an Y2 axis will be calculated and drawn automatically.
Second X-axis
If you want to show the second X-axis, you need to create an Axis object and it to the X2Axes property just like you do with the other axes. If you set the value of the X2Data or X2DataPath properties in an axes chart the axes will be drawn automatically based on your data.
XAML
When you want to write the code for your axes in design time using XAML the right way to do it is to initialize the whole AxesCollection rather than adding one more axis to it. This way the collection is reset and all axes that might have been added as default will be cleared.
XAML (correct)
 Copy Code Copy Code
|
|---|
<chart:BarChart Name="barChart1" Margin="0,0,26,28"> |

If you directly add the Axis, the collection shall not be reset, a possible default axis will be present and you migh end up having two axes instead of one:
XAML (wrong)
 Copy Code Copy Code
|
|---|
<chart:BarChart Name="barChart1" Margin="0,0,26,28"> |


