Charting for WPF allows users to change data of a bar in a bar chart or the coordinates of a point in a line chart. This is done by setting the Behavior property to Behavior.AllowXDrag or Behavior.AllowYDrag. The Behavior enumeration allows bitwise combining of its members.
1. If you want to allow dragging the data point in any direction you should use:
C#
 Copy Code Copy Code
|
|---|
lineChart1.Behavior = Behavior.AllowXDrag | Behavior.AllowYDrag; |
| VB.NET
Copy Code
|
|---|
lineChart1.Behavior = Behavior.AllowXDrag Or Behavior.AllowYDrag |
In bar charts you should only allow dragging in the direction of the bar - for horizontal bars this is AllowXDrag, for vertical it is AllowYDrag.
2. If you want to stop the drag behavior you should set the property to DoNothing:
| C#
Copy Code
|
|---|
lineChart1.Behavior = Behavior.DoNothing; |
| VB.NET
Copy Code
|
|---|
lineChart1.Behavior = Behavior.DoNothing |
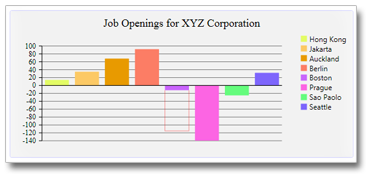
3. When the chart is dragged a thin red line appears to indicate the contour of the resulting graphic. If the graphic is dragged beyond values currently visible at the axes, the axes is rescaled automatically.