This tutorial illustrates how to specify multiple brushes for a PieChart as well as how to employ custom rendering in order to achieve particular effect. The following steps are explained in more details below:
- Prerequisites
- Defining the custom brushes
- Setting the chart brushes
- Custom-rendering DataRange entries
Prerequisites
This tutorial extends Tutorial 4. Therefore it is expected that the reader has finished with Tutorial 4 before reading further.
1. Defining the custom brushes
We define an array with brushes as a resource of the report itself. The array is defined in XAML using the x:Array extension. The code, which defines the brush array is highlighted in bold below:
XAML
 Copy Code Copy Code
|
|---|
<r:Report x:Key="myReport"> |
2. Setting the chart brushes
Now that the brushes are defined they can be easily referenced as a static resource and assigned to the Brushes property of the PieChart. The following XAML illustrates the modified declaration of the PieChart element within the report definition:
| XAML
Copy Code
|
|---|
<r:PieChart Location="225,0" Size="250,250" DataContext="{Binding CheapProducts}" TargetMember="UnitPrice" Brushes="{StaticResource PieBrushes}" PieStroke="Black" PieStrokeThickness="1" /> |
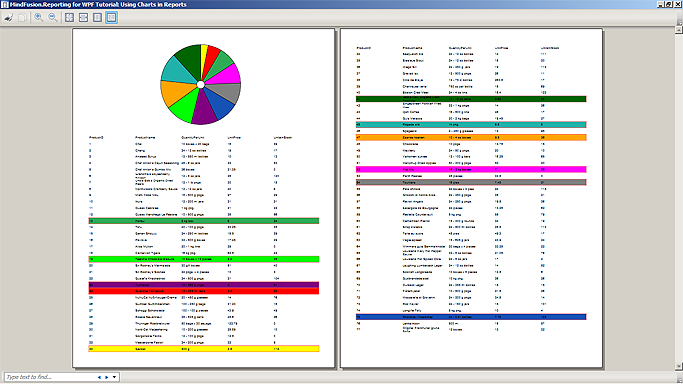
Running the report now will produce a colored pie chart. However it is not clear which products are represented by the chart pieces. To fix this, the background of the report entries can be modified to match the color of the corresponding pie chart pieces.
3. Custom-rendering DataRange entries
Custom rendering is performed by handling the Prerender event of the Report class. The following code illustrates handling of the event in C# and Visual Basic:
| C#
Copy Code
|
|---|
myReport.Prerender += new EventHandler<PrerenderEventArgs>(myReport_Prerender); |
| VB.NET
Copy Code
|
|---|
AddHandler myReport.Prerender, AddressOf myReport_Prerender |
The event can be handled at any point before the ReportLayout.RenderAllPages method is invoked. The event is raised for each individual item in the report after its visual representation is created but before it is added to the output. The rows in the DataRange are represented by ItemContainer objects. The DataContext property of each ItemContainer is set to the corresponding product row from the data set. The visual representation of the containers is specified through a WPF Border object. The custom-rendering code checks whether the current element is an ItemContainer and verifies if it corresponds to a "cheap product" by checking the UnitPrice field. If those conditions are at hand, the custom-rendering code sets the appropriate Brush to the background of the Border associated with the entry. The code of the event handler is listed below:
| C#
Copy Code
|
|---|
private void myReport_Prerender(object sender, PrerenderEventArgs e) |
| VB.NET
Copy Code
|
|---|
Private Sub myReport_Prerender(ByVal sender As Object, ByVal e As PrerenderEventArgs) |
Running the report now and switching to two-page layout will bring the following result: