This tutorial will demonstrate how to create and bind DataRange objects manually and how to create master-detail relationship between data-ranges representing related tables. The following steps are explained in more details below:
- Prerequisites
- Adding a new data adapter
- Nesting DataRange objects for master-detail implementation
- Providing details in a master-detail relationship
- Running the application
Prerequisites
This tutorial continues from where Tutorial 1: Getting Started has ended. It is therefore assumed that we have an existing application with a single data-bound report in it and a window with a set up DocumentViewer that displays an instance of this report.
1. Adding a new data adapter
Now that we have an existing data set and an adapter for the 'Products' table, we will expand this data source by creating an adapter for the 'Categories' table.
To do this, go to the 'Data Sources' window, select the 'nwindDataSet' and click the 'Configure DataSet with Wizard' button from the 'Data Sources' window toolbar. This will bring up the 'Data Source Configuration Wizard' that we used in Tutorial 1 in order to setup the data source initially.
 Note Note |
|---|
To open the 'Data Sources' window, select the Data -> Show Data Sources menu command. |
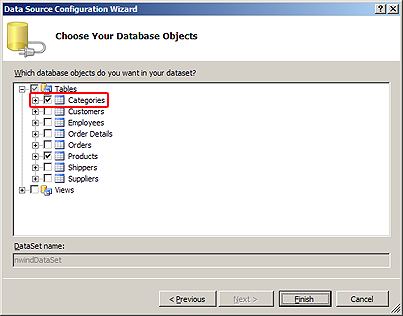
Expand the 'Tables' node and select the 'Categories' table by placing a check in the box to its left. Click 'Finish' to create a new table adapter for the selected table.
2. Nesting DataRange objects for master-detail implementation
We create a new DataRange object within the report's existing XAML declaration in a way similar to the one used in Tutorial 1. The new DataRange object is bound to the Categories data table and contains two elements - a Label and a Picture, bound respectively to the CategoryName and Picture fields in the Categories table. The XAML code below illustrates the code of the new DataRange object.
XAML
 Copy Code Copy Code
|
|---|
... |
Now we want to embed the old DataRange, showing products, within the newly created DataRange, showing categories and we want to establish a master-detail relationship between the two data ranges so that the result displays products, grouped by category. Here is the new XAML code of the report illustrating the embedded data ranges.
| XAML
Copy Code
|
|---|
<r:Report x:Key="myReport"> |
Note that the old DataRange (the one showing products) has had its data source removed. We will supply the data through the QueryDetails event depending on the category each instance of this DataRange belongs to. Note also that the products range now has a name associated with it. This will help us identify the range within the QueryDetails event handler as illustrated later in this topic. Finally, note that the Location of the embedded DataRange has been modified so that it is positioned correctly in its parent and its size is reduced to 60% so that it doesn't overlap with the image to the right.
Navigate to the window's constructor in the code behind and add the code necessary to populate the Categories table in the data set. Additionally, expose the existing adapter variable as a class field because it will be needed in the QueryDetails event handler. The following code (in bold) demonstrates this.
| C#
Copy Code
|
|---|
... |
| Visual Basic
Copy Code
|
|---|
... |
3. Providing details in a master-detail relationship
To provide a master-detail implementation for the two data ranges, we need to handle the QueryDetails event on the Report class. Keep in mind that the event must be handled before the Run method of the Report is invoked. The following code illustrates how the event handler should look.
| C#
Copy Code
|
|---|
void myReport_QueryDetails(object sender, QueryDetailsEventArgs e) |
| Visual Basic
Copy Code
|
|---|
Sub myReport_QueryDetails(ByVal sender As Object, ByVal e As QueryDetailsEventArgs) |
The code above inspects the report element, which requests details. This is usually a DataRange or a PieChart object. Then, it identifies the object by inspecting its Name. If the object is the one we are expecting, we provide the necessary details by matching the CategoryID of the products in the database against the ID of the category associated with the data range.
| Note |
|---|
Do not forget to include the System.Linq namespace in order the above code to compile successfully. |
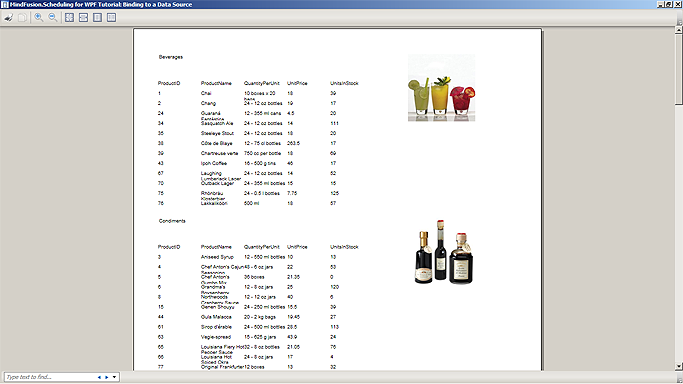
4. Running the application
Running the application will yield a result similar to the one illustrated by the following image: