|
|
 |
 |
|
| MindFusion.Charting for WPF 1.7 Released |
 |
|
|
|
| |
|
| |
| |
| |
Friday December 14, 2012
MindFusion.Charting for Wpf provides developers with an easy way to add line, bar, radar and pie charts to their Wpf applications. The control supports data binding, unlimited number of series and legends, fully customizable appearance. A new type of charts have been added to the control - the radar chart. Here are details about the new chart control and the other new add-ons:

|
|
|
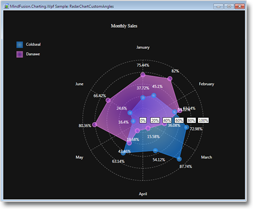
Radar Charts
The new radar chart control supports: |
- polar charts
- unlimited number of data series
- 4 types of labels at the inner axis and outer axes
- label borders
- customizable sweep angle and sweep direction
- spiderweb
- labels for each data series
- scatters
- custom labels
- and more.
The new release of Charting for Wpf adds several new samples that demonstrate the control. The demo has also been updated with the new charts. |
|
 |
|
|
|
|
 |
|
Hit Testing
You can test whether a given point is contained within a chart element with the new HitTest method. It will give you a list with all chart elements that contain the point. The HitTest method is supported by all chart types.
Visual Effects
Make your charts prettier by applying drop shadow or blur effect at the chart graphic. The new Effect property lets you do it for all types of charts.
|
|
|
|
|
| |
|
You can learn more about the new features at the news section in the Charting for WPF forum.
The trial version is available for direct download from this link:
Download MindFusion.Charting for Wpf 1.7
You are welcome to contact us with any questions, problems or inquiries about the Charting for Wpf control or any other of our products. MindFusion has always put special emphasis on providing excellent customer support and we usually answer your inquiries up to few hours of receiving them.
|
|
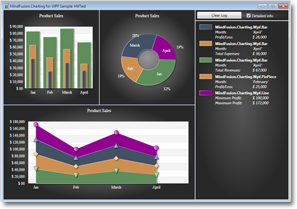
About MindFusion.Charting for Wpf: A programming component that combines powerful charting capabilities with a simple API and easy use. Among the features of the control are fully customizable grid, positive and negative values on all chart axes, 3D charts, gauges and many more - read them here.
The control provides detailed documentation and many different samples that show how to customize it. It supports all major chart types - bar, line, radar and pie, as well different modifications of them - column, doughnut, polar, area charts etc.
Licenses are counted per user, distribution is royalty free. Each license guarantees full technical support. The source code is also available. |
|
|
|
|
|
|
|
|
 |
 |
|
|
|
 |
| |
 |
 |
|
|
|
|
| |
|
|