Search
Tutorial 3: Create a Custom Node Type

This tutorial shows how to define a custom node class that adds several new properties and graphics elements through a template. The code is also available in Samples folder of JsDiagram distribution.

1. Create empty Tutorial3.html and Tutorial3.js files, and add DIV and CANVAS elements to the HTML page.

HTML  Copy Code
<!-- The DiagramView component is bound to the canvas element below -->
<div style="width: 100%; height: 100%; overflow: auto;">
    <canvas id="diagram" width="2100" height="2100">
        This page requires a browser that supports HTML 5 Canvas element.
    </canvas>
</div>

2. Add script references to the MindFusion UMD scripts and Tutorial3 JavaScript files:

HTML  Copy Code

<script src="umd/collections.js" type="text/javascript"></script>
<script src="umd/drawing.js" type="text/javascript"></script>
<script src="umd/controls.js" type="text/javascript"></script>

<script src="umd/animations.js" type="text/javascript"></script>
<script src="umd/graphs.js" type="text/javascript"></script>
<script src="umd/diagramming.js" type="text/javascript"></script>

<script src="Tutorial3.js" type="text/javascript"></script>

3. In Tutorial3.js, assign shorter names to the DiagramViewDiagram, CompositeNodeBehavior, Alignment and Rect types (if using diagram's ES6 or CommonJS modules, these would be import or require statements for respective classes and modules).

JavaScript  Copy Code

var DiagramView = MindFusion.Diagramming.DiagramView;
var Diagram = MindFusion.Diagramming.Diagram;
var CompositeNode = MindFusion.Diagramming.CompositeNode;
var Behavior = MindFusion.Diagramming.Behavior;

var Alignment = MindFusion.Drawing.Alignment;
var Rect = MindFusion.Drawing.Rect;

4. In Tutorial3.js call the classFromTemplate static method of CompositeNode to generate a node class from a template. The template is defined through an object literal that lists layout containers and graphics primitives from which a node should be composed.

JavaScript  Copy Code

var OrgChartNode = CompositeNode.classFromTemplate("OrgChartNode",
{
    component: "GridPanel",
    rowDefinitions: ["*"],
    columnDefinitions: ["22", "*"],
    children:
    [
        {
            component: "Rect",
            name: "Background",
            pen: "black",
            brush: "white",
            columnSpan: 2
        },
        {
            component: "Image",
            name: "Image",
            autoProperty: true,
            location: "ceo.png",
            margin: "1",
            imageAlign: "Fit"
        },
        {
            component: "StackPanel",
            orientation: "Vertical",
            gridColumn: 1,
            margin: "1",
            verticalAlignment: "Near",
            children:
            [
                {
                    component: "Text",
                    name: "Title",
                    autoProperty: true,
                    text: "title",
                    font: "Calibri bold"
                },
                {
                    component: "Text",
                    name: "FullName",
                    autoProperty: true,
                    text: "full name",
                    pen: "blue",
                    font: "Calibri 4",
                    padding: "1,0,1,0"
                },
                {
                    component: "Text",
                    name: "Details",
                    autoProperty: true,
                    text: "details",
                    font: "Calibri 3"
                }
            ]
        }
    ]
});

Diagram.registerClass(OrgChartNode, "OrgChartNode", "OrgChartNode", 1, CompositeNode);

5. Create a DiagramView instance wrapping the HTML Canvas element. Add some nodes of the new class and create links between them. The autoProperty attribute in template above will generate setter methods for properties whose name is specified via name attribute.

JavaScript  Copy Code

var diagram = null;

document.addEventListener("DOMContentLoaded", function ()
{
    // create a DiagramView component that wraps the "diagram" canvas
    var diagramView = DiagramView.create(document.getElementById("diagram"));
    diagram = diagramView.diagram;

    // enable drawing of custom nodes interactively
    diagram.customNodeType = OrgChartNode;
    diagramView.behavior = Behavior.Custom;

    var node1 = new OrgChartNode(diagram);
    node1.bounds = new Rect(25, 15, 60, 25);
    node1.title = "CEO";
    node1.fullName = "John Smith";
    node1.details =
        "Our beloved leader. \r\n" +
        "The CEO of this great corporation.";
    node1.image = "ceo.png";
    diagram.addItem(node1);

    var node2 = new OrgChartNode(diagram);
    node2.bounds = new Rect(25, 55, 60, 25);
    node2.title = "CTO";
    node2.fullName = "Bob Smith";
    node2.details = "The technology chief of this great corporation.";
    node2.image = "cto.png";
    diagram.addItem(node2);

    // ...

    diagram.factory.createDiagramLink(node1, node2);
});

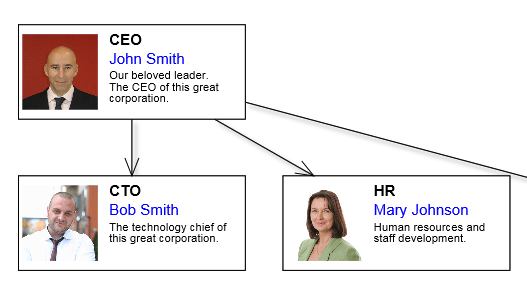
6. Publish MindFusion.*.js and tutorial files using web server of your choice. Now you should see this if you open Tutorial3.html in a web browser: