


Tutorial 5: Adding a RadarChart to a Report
This tutorial demonstrates how to use RadarChart elements in a report. The following steps are described in more details below:
The tutorial does not have any special prerequisites. However it is assumed that the reader is acquainted with the creation of MindFusion.Reporting applications. For more details on this, check Tutorial 1. Also, the process of adding the data source and binding the chart to it is briefly described. For information on how to perform data-binding in reports, refer to Tutorial 2.
Create a new application ('Tutorial5') and add a single MindFusion.Reporting report to it. Name the report 'RadarChartReport'. Open the report in the Visual Studio Designer and drag and drop a RadarChart element from the Toolbox to the report surface. This will create a new instance of the RadarChart class and add it to the report.
Select the RadarChart element within the designer and open the 'Properties' window. Set the following properties, in no particular order:
Modify the chart's title settings as follows:
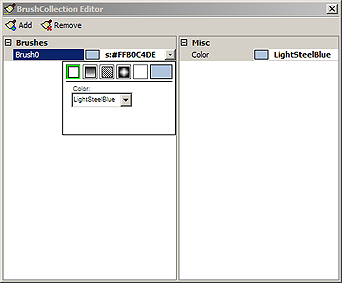
To modify the brush and pen of the area drawn by the radar chart, navigate to the ChartBrushes property in the Properties window, select it and click on the '...' button at its right. The 'BrushCollection Editor' dialog appears. Click on the 'Add' button in the toolbar to create a new brush. Select the brush in the property grid below and click the drop-down arrow. In the brush editor click 'Solid' and enter LightSteelBlue for a value of color. The following image illustrates this:
The area pen is specified in a similar manner, only this time edit the ChartPens property. Add a single pen with DarkSlateBlue color, as shown below:

Resize the report page by setting its ContentSize to "180, 100".
Add the 'Category Sales for 1995' view from the nwind.mdb database to the project. Extensive information on how to add data sources to a project can be found in both Tutorial 1 and Tutorial 2.
After rebuilding the project a new category will be visible in the Toolbox - 'Tutorial5 Components'. This new category contains two items - nwindDataSet and Category_Sales_for_1995TableAdapter. While the designer is active, double-click on any of these items in order to instantiate them. The nwindDataSet1 and category_Sales_for_1995TableAdapter1 are created and added to the report and can now be observed at the bottom side of the report designer.
To bind the radar chart to the newly created data source, set its DataSource to nwindDataSet1 and its DataMember to "Category Sales for 1995". Set the DataField property to the appropriate field in the data table, in this case - "CategorySales".
Set OuterAxisLabelType to CustomText and OuterAxisLabelsField to "CategoryName".
Finally, go to the source code of our report and modify its constructor as following:
C#
 Copy Code Copy Code
|
|---|
public RadarChartReport() |
| Visual Basic
Copy Code
|
|---|
Public Sub New() |
For more information on how to create a ReportViewer, refer to Tutorial 1. Leave the default name of the newly created viewer - reportViewer1. Create an instance of our report and select it within the report viewer.
| C#
Copy Code
|
|---|
public Form1() |
| Visual Basic
Copy Code
|
|---|
Public Sub New() ' Select the report in the viewer |
The following image illustrates the result when running the application:


