Tutorial 3: Customizing Your Report
This tutorial illustrates how to adjust various settings of a report in order to customize its appearance. The following steps are explained in more details below:
This tutorial continues from where Tutorial 2: Binding to a Data Source has ended. It is therefore assumed that the reader is acquainted with Tutorial 1 and Tutorial 2 before reading further.
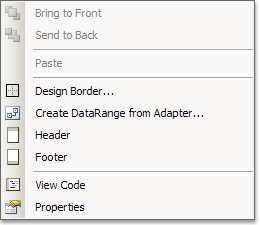
You can add header and/or footer to a report page by right-clicking on the page surface in the Designer and selecting respectively the 'Header' or 'Footer' command from the context menu that appears. Selecting the same command again will remove the header and/or footer from the report. Removing a header or footer clears all the report elements contained within them.
For the purposes of this tutorial, lets add a footer to the report. Report elements are added to the footer in the same way they are added to a page - by dragging them from the Visual Studio Toolbox and dropping them onto the header/footer surface in the Designer.
Create a new Label within the footer and set its Location to "0mm, 0mm", its Size to "100%, 10mm" and its Alignment to "Center".
Set the Text property to "[PageCurrent()] of [PageCount()]". The specified text contains the so-called Expressions. The expressions found within the text are evaluated when the report is processed and the result of the evaluation is used in the final label text. To learn more about expressions, see Overview. To learn how to use expressions in label texts, see Using Expressions in Reports.
Finally, set the height of the of the footer itself to "10mm" so that it is exactly as big as the label it contains.
The report designer will now look similar to the image below. The newly created footer and its label are outlined with red.
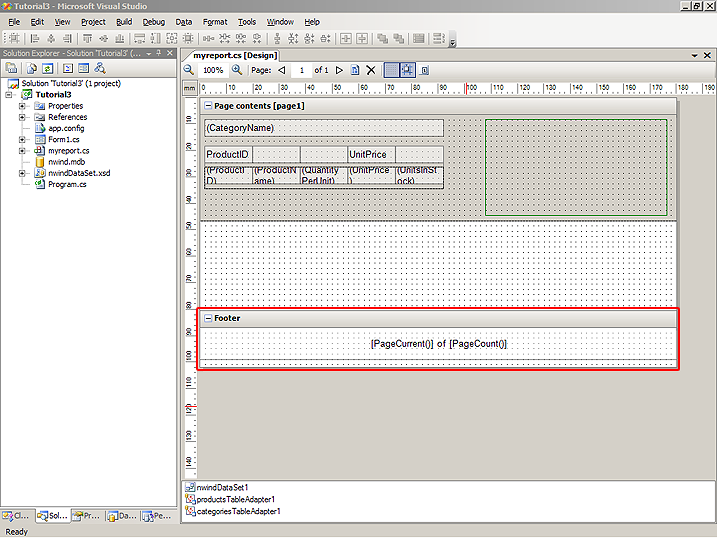
If you run the application now, you will notice a small text at the bottom of each page specifying the current page and the total number of pages in the report.
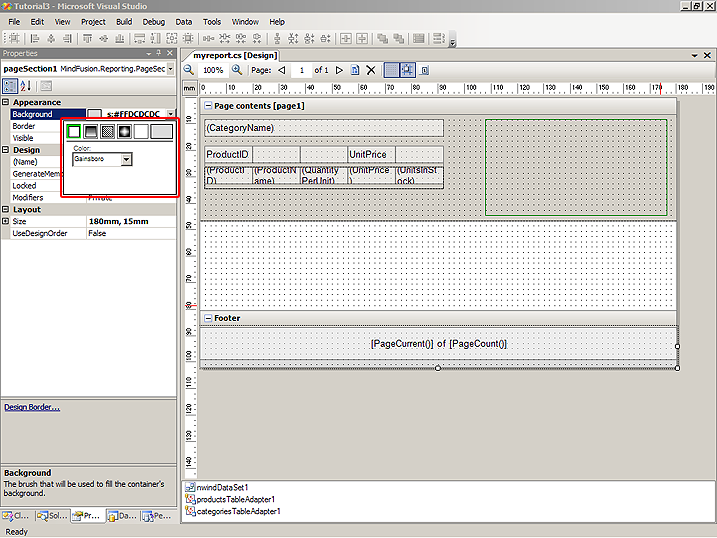
Many report elements allow their background color to be changed. The page header/footer and the page itself allow this too. In this tutorial we will set the background of the footer, created in the previous step, to Gainsboro. To do this, select the footer in the Designer, navigate to its Background property in the Property grid, click the drop-down arrow to the right and select the 'Solid' brush from the drop-down brush editor that appears. The following image illustrates this:
Now we will customize the background of the alternating rows of the internal data range. To do this, select the data range, navigate to its AlternatingBackground property in the Property grid and set it to PaleGoldenrod solid brush the same way we set the brush of the footer above.
Finally, select the header of the internal data range and change its brush to a LightSteelBlue solid brush.
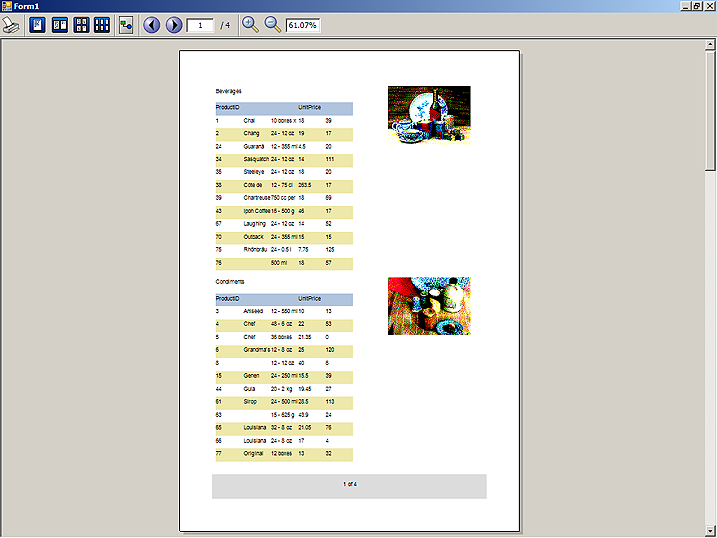
Running the application will yield the following result:
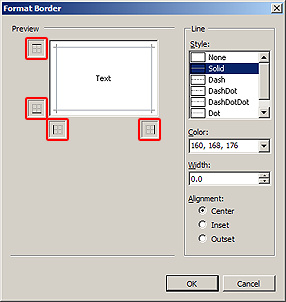
Many report elements allow their border to be customized. In this tutorial we will set the border of the outer data range. To do this, select the data range and navigate to its Border property in the Property grid. The value of this property cannot be set directly. Click on the '...' button to the right of the property value in order to invoke the Format Border dialog box.
In the Format Border dialog box setup the line properties to the right, then click on the buttons corresponding to the various border sides to the left. Set Style to "Solid", Color to "160, 168, 176", Width to "0.0" and Alignment to "Center", then click on each of the four buttons to the left, to indicate that the border will have all four sides. Click 'OK' to confirm. The following image shows the Format Border dialog box:
 Note Note |
|---|
The Format Border dialog box can be alternatively displayed by clicking on the "Design Border..." command in an element's context menu. |
You can customize the font of individual labels or of the entire report. Changing the font of the report will automatically change the font of all labels on that report whose font has not been explicitly changed. In this tutorial we will change the font of the report to ensure that all texts fit in their corresponding elements. Select the report (by clicking outside of the page in the Designer for example), navigate to its Font property in the Property grid and set its value to "Arial, 8pt".
Running the report now reveals some minor flaws that we might want to get fixed. For example, the instances of the outer data range appear to be adjoined to each other because of the border we applied to the data range earlier. To insert some spacing between adjacent instances, set the Bottom component of the Margin property of the outer data range to, say, "5".
We may further improve the report by preventing the data range instances to split accross pages. In order to do this, set the AllowSplit property of the outer data range to false.
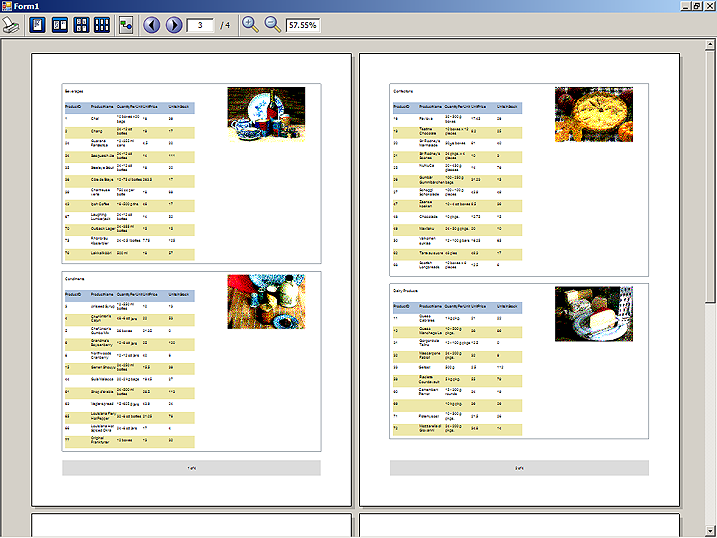
Running the application now and setting the viewer to display two pages at once will result in the following: