|
|
 |
 |
|
| Diagramming for JavaScript 1.4 Released |
 |
|
|
|
| |
|
| |
| |
|
| |
Wednesday January 2, 2013
MindFusion has released a new version of its diagramming library for JavaScript. Here is an overview of the most important new features in the control:

|
|
|
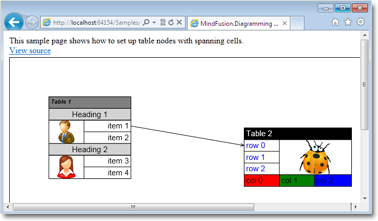
Table Nodes
Table nodes display tabular data and are the standard when you want to build database diagrams, or class hierarchies. Tables have cells that are arranged in a grid. Every cell can hold images and text. You can customize cells, rows and columns in a variety of ways - by setting their extent, style, image and text alignment. Tables support scrolling. |
 |
|
|
|
|
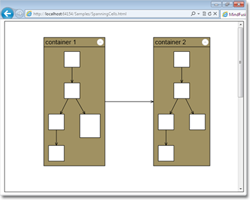 |
Container Nodes
Container nodes can hold other diagram nodes. When you move a container nodes, all its child nodes are moved along. Containers can be nested within each other without restriction of the depth. You can fold a container to hide its children and unfold it to show them. Nodes in the container can be linked to nodes both inside and outside it.
|
|
|
|
|
Miscellaneous
 The Locked property can be used to disable interaction with a diagram item. The Locked property can be used to disable interaction with a diagram item.
Improved rendering speed when changing items' appearance properties.
|
|
|
|
You can find out more about the new release at the Diagramming News section on our forum. You are welcomed to download the trial version and check yourself the capabilities of the control. Use the link below:
Download MindFusion.Diagramming for JavaScript Library 1.4
|
|
Technical support
We have always taken special effort in providing quality technical support to all our clients and evaluators. You can write us at e-mail support@mindfusion.eu or use the help desk. JsDiagram, like all MindFusion components, has a special section on our forum where you can ask any question about the tool and of course, get competent and quick answer.
|
|
|
|
About Diagramming for JavaScript Library: Written 100% in JavaScript, this tool uses HTML5 Canvas to draw impressive diagrams, schemes, flowcharts, trees and many more. It is browser independent, easy to use and integrate into any web application. JsDiagram supports a variety of predefined node shapes, customizable links, rich event set and many appearance options. The user interaction model includes resizing / moving / selecting and modifying any diagram element.
The tool boasts an elegant API, which is documented in details as well numerous step-by-step guides and tutorials. Various samples are provided to let you learn quickly how to use the most important features of the library - check them here. JsDiagram is not only the perfect choice for creating any type of diagram in the browser - it can also arrange it the way you wish with a mouse click using one of its automatic
layouts. For more details about the features of the component, please visit the features page.
|
|
|
|
|
|
|
|
|
 |
 |
|
|
|
 |
| |
 |
 |
|
|
|
|
| |
|
|