


Standard Item Types
Diagram elements in MindFusion.Diagramming for JavaScript are represented by DiagramNode and DiagramLink instances. Combined and linked together, they can form complex data structures such as process or entity-relationship diagrams, class hierarchies, networks and graphs. Each of their rich features can be customized through numerous methods and properties.
ShapeNode objects can represent geometric shapes, flowchart elements, icons in network diagrams, and so on. They can display both graphics and text in different fonts, sizes and colors. A node's shape is specified by setting its shape property. There are more than 100 predefined node shapes and apart from them, MindFusion.Diagramming for JavaScript offers an easy way to define custom shapes. Shape nodes can be rotated, either interactively using the round selection handle drawn above them, or programmatically by setting their rotationAngle property.
The SvgNode class represents nodes that can display SVG drawings. SVG graphics are rendered instead of image, and on top of the geometry rendered by the base ShapeNode class. Enable the transparent property to hide the node's geometry and leave only the drawing visible. The SVG file is loaded and associated with the node through an SvgContent object, which should be initialized and then assigned to the content property.
A TableNode displays tabular data, and can be used to represent table schemas in database diagrams or classes in class-hierarchies. A table contains cells arranged in a grid, and every cell can display text and/or image. Cells, columns and rows can be customized in various ways - there are properties available for setting their extents, style, image and text alignment. Tables' dimensions can be programmatically changed; inserting, appending or deleting rows and columns can be done in a very comprehensive, intuitive way whenever you might need it. Tables can also display background images and graphics.
A ContainerNode can contain other diagram nodes. When a container is moved, its child nodes move too. Containers can be nested within each other to unlimited depth. They can be folded to a smaller size, hiding their child items, and unfolded to show content again. Nodes inside a container can be linked to nodes both inside and outside of it. If a link connects items in the same container, the container is not considered an obstacle by the auto-routing algorithm.
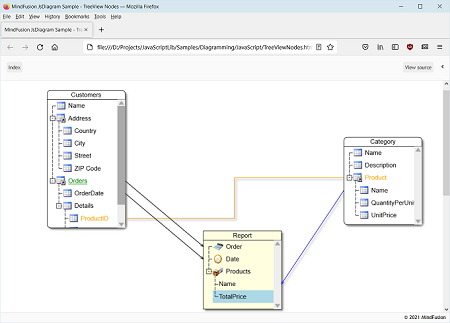
The TreeViewNode class represents nodes that can display hierarchical data. The root items displayed in the node can be accessed through the rootItems property. Items can be added and removed individually by using the addItem and removeItem methods, or in bulk by calling the fromObject method, which loads the tree view items from an array of objects.
VideoNode objects display video streams, along with UI elements to play, pause, seek and change volume. Set node's videoLocation property to specify its video URL. Auto-playing is not supported at this time, and the video can be started only by users clicking the play button. VideoNode is built around Video component, which can also be used in CompositeNode templates.
ControlNode objects display custom HTML content, specified via their template property. A node's DOM structure is created inside the Content div element, which is then rendered on top of the diagram canvas. Note that this prevents ControlNodes drawing in diagram' usual Z order, and they will always appear on top of other diagram items. By default the diagram intercepts mouse events of all hosted html elements to enable moving nodes or drawing links. You can specify that interactive elements, such as buttons or text boxes, should receive input instead by setting their data-interactive attribute to true.
DiagramLink objects are used to represent various types of connections and relations in diagrams. MindFusion.Diagramming for JavaScript offers three basic link shapes, which can be assigned to links' shape property:
A link can be connected to a node at each of the link's ends. It is also possible to have unconnected links - having one or both of their ends not connected to nodes. Some customizable link's properties are: arrowheads, style, text, pen width and style, modification behavior and number of segments.
See Also
Controlling User Interaction


