Building A Chart With Axes
Follow the steps from first tutorial to load the diagram scripts, and add a "lineChart" DIV element. Now create the JavaScript chart instance:
JavaScript
 Copy Code Copy Code
|
|---|
// create the chart |
If we want to show the zoom buttons, here is how to do it:
| JavaScript
Copy Code
|
|---|
lineChart.showZoomWidgets = true; |
For ticks on the axes use these properties:
| JavaScript
Copy Code
|
|---|
lineChart.showXTicks = true; |
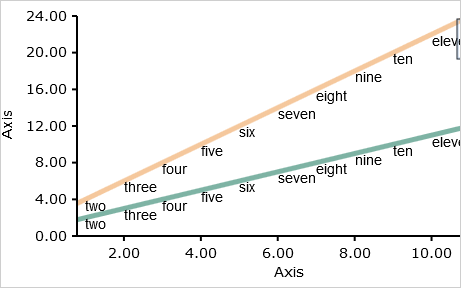
Each predefined chart type e.g. line, bar, pie, radar etc. has series property, where you can add series. In our sample chart, we'll create two series. They are of type Series2D and can be used with any chart type that needs to draw 2D graphics:
| JavaScript
Copy Code
|
|---|
// create sample data series |
The constructor of the Series2D class requires three arguments. The first two are the data for the X and Y axis, the last one is for the labels. If you don't need labels, you can specify null.
| JavaScript
Copy Code
|
|---|
var series1 = new Charting.Series2D( |
| JavaScript
Copy Code
|
|---|
lineChart.xAxis.minValue = 0; |
When you are ready with the settings, don't forget to draw the chart:
| JavaScript
Copy Code
|
|---|
lineChart.draw(); |
And here is the chart: