Search
Data Binding

In this tutorial we’ll use a list of objects for data provider. The objects are instances of a custom class and expose various properties. We will bind data properties of a radar chart with property fields of our custom class.

I. Initialize the StudentData class:

JavaScript  Copy Code

var StudentData = (function () {
        function StudentData(subject, gpa1, gpa2, gpa3) {
            this.Subject = subject;
            this.GPA1 = gpa1;
            this.GPA2 = gpa2;
            this.GPA3 = gpa3;
        }
        return StudentData;
    }());

 
II. Create a collection of StudenData objects:

JavaScript  Copy Code

var data = new Collections.List();
        var subjects = new Array("Math", "Physics", "Chemistry", "Biology", "IT");
        var gpa1 = new Array(2.3, 1.7, 2, 4, 3.7);
        var gpa2 = new Array(3.3, 2.7, 1.7, 2, 3.3);
        var gpa3 = new Array(4, 3.7, 2, 1, 1.3);
        for (var i = 0; i < 5; i++)
            data.add(new StudentData(subjects[i], gpa1[i], gpa2[i], gpa3[i]));

 
III. Add a Radar Chart:

JavaScript  Copy Code

//get the HTML Canvas
var chartEl = document.getElementById('radarChart');
var radarChart = new Controls.RadarChart(chartEl);

//specify the data source
radarChart.dataSource = data;

IV. Bind Data Fields to Data Properties of the Control:

JavaScript  Copy Code

radarChart.xDataFields = radarChart.yDataFields = new Collections.ObservableCollection(["GPA1", "GPA2", "GPA3"]);
radarChart.innerLabelsDataFields = new Collections.ObservableCollection(["GPA1", "GPA2", "GPA3"]);
radarChart.toolTipsDataFields = new Collections.ObservableCollection(["Subject", "Subject", "Subject"]);


Here three series, each one using X-data, Y-data and tool tips text from the respective data field are created. Note that the control creates these DataBoundSeries objects automatically, we don't initialize them. Each data field results in one DataBoundSeries being created.

Don't forget to call the dataBind() method for it to work:

JavaScript  Copy Code

radarChart.dataBind();
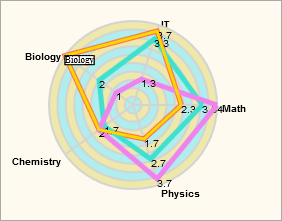
Here is the chart: