Styling Chart Series
When you want different styling for each element in a single series e.g. each pie piece, bubble, scatter etc, the right way to do is to use the PerElementSeriesStyle class. The constructor can take up to four arguments, all of them optional.
 Note Note |
|---|
Each argument in the PerElementSeriesStyle is of type List that holds other List-s. |
The logic is that the PerElementSeriesStyle class serves charts that might use multiple series. Since the style property is one for all series, it must provide a way to specify the style settings for all elements in all series. The style settings are taken consequently in the order they were added and applied to the series at the same index as the index of the array with the styling properties.
Initialize brushes for each element in the series:
JavaScript
 Copy Code Copy Code
|
|---|
var brushes = new Collections.List([ var seriesBrushes = new Collections.List(); |
Now the seriesBrushes variable is ready to be passed to the PerElementSeriesStyle constructor. Let's initialize one Brush for the outlining of each element. When the count of elements in the style settings array is less than the count of data in the series, the control cycles the styling settings. For the outlining, we'll use a single Bursh. Nonetheless we must put it in a nested array as well:
| JavaScript
Copy Code
|
|---|
var pens = new Collections.List([ var seriesPens = new Collections.List(); |
We repeat the same initialization for the thickness of the pens. We use a pie chart and we want a thick pen:
| JavaScript
Copy Code
|
|---|
var thicknesses = new Collections.List([ |
If you want to set a special dash style, you can set it this way:
| JavaScript
Copy Code
|
|---|
var dashStyles = new Collections.List([ |
The DashStyle enumeration lists different dash styles, which you can use. Now, let's assign the style to the chart.
| JavaScript
Copy Code
|
|---|
|
Don't forget to draw the chart:
| JavaScript
Copy Code
|
|---|
pieChart.draw(); |
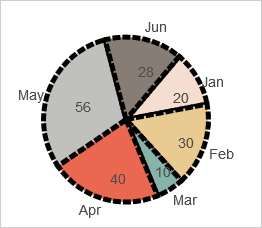
Here is the result: