Grid
In the basic chart controls - LineChart, BarChart etc. you access the gridType property directly:
Grid
 Copy Code Copy Code
|
|---|
chart.gridType = Charting.GridType.Vertical; |
Styling is done through the theme property of the control:
| JavaScript
Copy Code
|
|---|
chart.theme.gridColor1 = Drawing.Color.fromArgb(0.4, 0, 0, 0); |
The Theme class offers a lot of styling options for grids: gridLineColor, gridLineThickness and gridLineStyle help you style the grid lines. By default no grid lines are drawn.
Grid in complex charts is easy to set with the gridType property that is exposed by the container:
| JavaScript
Copy Code
|
|---|
var plot1 = new Charting.Plot2D(); plot1.gridColor1 = new Drawing.Color("white"); |
The Plot2D chart offers several properties that you can use to customize the grid: gridColor1, gridColor2 and the pinGrid property, which sets how the grid responds when the user scrolls the chart interactively.
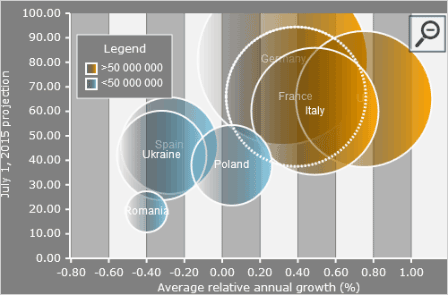
A bubble chart with custom grid: