MindFusion.Silverlight Pack is a set of programming components that are easy to integrate and customize. Develop fantastic diagrams, calendars, charts, maps and reports with minimum effort. Concentrate on the logic of your application. Leave coding and debugging to MindFusion.

MindFusion.Diagramming for Silverlight offers you a rich user interaction model with copy and paste, panning, grid alignment and much more. The component boasts more than 15 automatic layout algorithms and more than 100 predefined node shapes. You can build tables with unlimited number of rows and columns, display hierarchical data in TreeViews and rotate shapes at arbitrary angles. When your diagram is ready you can store it as an XML document, ASCII string or file in the Silverlight local storage.
Thiscomponent is the ideal tool to build any type of schedule and calendar for Silverlight. It supports recurring events and allows definition of custom-typed events and resources. For the look you can choose among six calendar views, which are very easy to change. Users can edit items in-place and modify and create them interactively. The appearance of the calendar is Template-based and there is a set of predefined themes as well as many header, item and text effects.
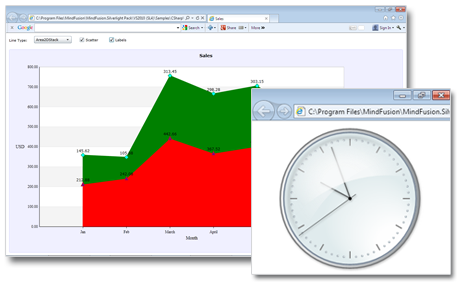
Building a beautiful chart is a matter of minutes with the chart control. You can choose among five label types at the axes and rotate the labels as you wish. Labels at data points, scatters, stacked charts and detached pieces in pie charts are some of the features of the control. You can add as many legends as you need and locate them as you choose. There is no limit to the number of data series. The data source can contain either DateTime or numerical values.
The gauge control supports two types of gauges - oval and linear, which visualize quantities in circular and linear layout. Every gauge scale can have ticks, labels, pointers, ranges and other elements. Gauge scales support interactivity and animation. The minimum and maximum values displayed at each gauge are custom-set. The value distribution along the scale geometry can be linear, geometric or whatever other function you need. Scales can host any Silverlight FrameworkElement and their appearance is completely customizable.


MindFusion.Reporting supports all .NET data sources and you can use more than one data source in a single report. You can add pictures, charts and any other Silverlight control to a report. There are no limits to the number of report pages. For output you can choose to print the report, render it in the full-featured MindFusion.ReportViewer or export is as an Office Open XML, PDF or HTML file.
Thecomponent supports the full features set for creating a project management solution. You can create unlimited number of activities, dependencies and resources. Each item can be modified and deleted, all operations support undo and redo. Two charts are at your disposal - an activity chart and a resource chart. You can control the user interaction with the Gantt chart by the rich set of events that the component provides.
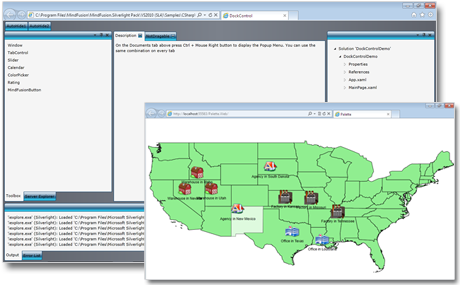
MindFusion.Mapping for Silverlight is the perfect tool to add a map to your web application. It supports a large set of predefined ESRI shape files with various geographic, administrative and political data. Each map is completely customizable - you can choose its colors, the number of its layers and much more. The control supports events and advanced pan and zoom.
The UI set contains a variety of customizable components that will give your application a polished and sophisticated look. It includes an accordion control with unlimited number of items, a calendar control with a variety of options for displaying time and dates, a color picker with specialized color editor, rating control that shows rating values in a different formats and much more.
